Findings, method and arithmetic — from twenty-five years of running the business, not from the internet.
Both Ends of the Transaction
Twenty-five years selling to the world on one side of the transaction, twelve years driving it around on the other — and what it means for a marketer to hold both the measurement and the event the measurement was supposed to capture.
The column that makes a year of writing into a dataset rather than a stack of posts.
Four parts, written over two weeks. Read them in order, or jump to the one that answers a
question you have now.
Why twenty-five years of selling and twelve years of driving is marketing analytics, not anecdote.
You can walk past a hundred of these and only ever see the cap. Both sides of a transaction work the same way — the structure is on the side nobody turns over.
I have spent twenty-five years selling things on the internet, in a business I founded back in 2001, at the time of the famous dot-com bust. Since then, I have leveraged what I learned in that business to author 17 books — published by an actual publisher (not self-published). I am most of the way through a master's degree in digital marketing analytics, and I hold a graduate certificate in business analytics and a bachelor's degree in business from long before that. I am also a technical person, a systems developer for the past thirty years. Those are the credentials, and they are real.
They are not the reason you should read this.
The reason is that I have spent a quarter of a century on one side of a transaction, as a seller, and twelve years on the other, as a service provider — and almost nobody writing about marketing has done both.
On the selling side I have overseen tens of thousands of retail sales from an internet business going back to the early days of the internet, to customers in more than fifty countries. I also personally answered thousands of customer service inquiries. On the service side, driving for Uber and Lyft, I gave ten thousand rides over twelve years across half a dozen states, and talked to thousands of people.
I have only sporadically written about any of it publicly. I intend to more writing here in this blog, because I think these stories contribute something real to the understanding of marketing analytics — and to the subject matter of the business I have built to consult on it.
I want to explain that connection more clearly.
Why these are analytics and not just anecdotes
Marketing analytics has one hard problem sitting underneath all the others. Every number you get is a shadow of a decision you did not see.
A click. A conversion. A five-star rating. An abandoned cart. Together they amount to a customer journey. Each element is a compressed record of something a person did, for reasons nobody wrote down. The analyst's entire job is reasoning backward from the shadow to the decision. Attribution modeling, segmentation, cohort analysis, testing — all of it is an attempt to work out what happened in a room you were not standing in.
For twenty-five years I have had the shadow. Order records, traffic, catalog performance, marketplace reports, twenty-five holiday seasons of demand data.
For a lot of those same years, I was also in the room.
I answered the customer service email myself, so I know what the person who abandoned the cart was actually confused about — not what the funnel report guessed. I sat in a car with someone while they decided which of two apps to open over a twenty-five cent difference. I was rated thousands of times by people sitting three feet away from me, so I know exactly how little those stars recorded about what had just happened.
That is not a metaphor, and it is not a nice way to introduce a story. It is an unusual methodological position: having both the measurement and the event the measurement was supposed to capture, for the same transactions, over years. Almost nobody has that. Practitioners have the numbers and not the room. Researchers have careful method and a recalled account of the room. Big data sees the broad shape of millions, even billions, of data points, but not the individual stories. I have field notes from inside the room, and the reports for the same period.
Concretely, here is what that produces.
The analytics problem
What being in the room adds
Construct validity — does the metric measure the thing you think it measures?
I lived under a five-point rating for twelve years. 10,000 rides. My Uber rating is 4.94 and my Lyft rating is 5.0. I have a good idea which rides produced which scores, and the score tracked the absence of friction, not the presence of value. That is a construct validity problem you can hold in your hand.
The customer journey — most maps are reconstructed from touchpoint logs
I watched complete journeys end to end. Someone comparing two prices on two phones, deciding, and riding. And on my side, the path from a phrase somebody typed into a search box to me taping a box shut. I can tell you which parts of a journey map are observed and which are inferred, because I have seen both halves of the same journey.
Attribution — which touch gets the credit
I sold to institutions where the purchase was the last step of an approval chain running a year long, and no analytics package saw any of it. If a model gave the credit to the final session, the model was wrong, and I can say why.
Selection and sampling — who is actually in your data
My riders are a convenience sample of people who hailed a car in one region. My customers are a self-selected group who already wanted a historical image. Neither generalizes, and knowing precisely how a sample is bent is more useful than pretending it is not. You can read what riders wrote.
Instrument design — you only get the answers your instrument allows
Two instruments, the same rides. A five-star tap produced almost nothing. An eleven-dollar notebook in the back seat produced hundreds of pages. The difference is not effort. It is design, and it is the most transferable lesson in this whole essay.
The stories are not decoration on top of the analysis. Each one is a case where I can see the mechanism behind a number, and the mechanism is what a marketer actually needs. A number tells you that something moved. Only the mechanism tells you what to do next.
I estimate I have 2,000 – 3,000 thousand stories to tell in the coming weeks, months and years. I hope you will join me for some of them.
The problem with most marketing writing
Marketing advice tends to come from two kinds of people.
The first kind works at an agency or a consultancy. They see real accounts, real budgets and real outcomes. They also sign agreements that stop them describing any of it in a way you could learn from. So the writing comes out sanded down — a case study with the numbers removed, a lesson with the client's name replaced by "a mid-sized manufacturer." Useful sometimes. Never specific.
The second kind is academic. They can publish freely, and the method is usually sound. But the underlying data is almost always people reporting what they think they did, some time after they did it, on a panel they were paid to join. There is a well-known gap between what people say they do and what they actually do. Nobody in that world denies it. It is just very hard to get around. Other industries have the same problem.
And yet the gold standard these days for getting your message across — for marketing a business at all — is storytelling. Which requires having lived through something worth telling.
All these groups are missing the same thing. Not one of them has run a business where the customers arrive one at a time for twenty-five years, where the owner personally answered thousands of service inquiries. And few can also say they spent twelve years on a second job watching ordinary people make ordinary decisions in real time, with nobody performing for a researcher.
A dining guide built in 1994, a business started because the rent was due, and the customers who found it without being asked.
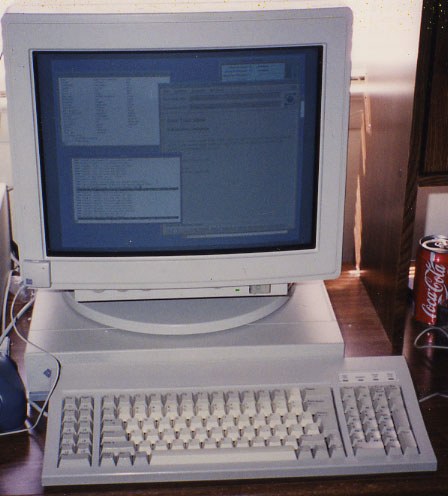
Sun SPARCstation 1+ “pizzabox”, 25 MHz SPARC processor, early 1990s. More details
Where my journey started: a Unix terminal in 1994
In 1994, about six years after I finished my undergraduate degree in business and finance, I had access to a Sun Sparc Unix terminal at the National Institutes of Health, where I was working as a computing researcher. That meant I had access to the internet at a point when almost nobody outside a university did. The World Wide Web had been invented five years earlier by Tim Berners-Lee. The network itself had only gone commercial the year before, after the US Congress authorized its use for commercial purposes.
For the first time, anyone could build a website. So I built one — a restaurant review guide to Washington DC, put together with another scientist at the lab. It got noticed. I remember meeting with a food and wine editor from a magazine who loved it.
I then tried to sell the idea of a series of web-based dining guides to major publishers. I got real interest from two of them — Fodor's, the major travel guide, published by Random House, and Zagat, the leading customer-review restaurant guide. I actually spoke with Tim Zagat, the publisher himself. Interest, and then no action taken. That was my first experience of a good meeting that goes nowhere, and it would not be my last, although I did register a copyright on the property. It was probably the first online dining guide ever copyrighted, long before Yelp or TripAdvisor existed.
It is worth pausing on what that first website actually was, because it is the same thing I have been doing ever since. It was a list of items, described well enough that a stranger could find the one they wanted. Not a campaign. Not persuasion. A structured catalog with good metadata. Had I not taken it down in 1995, and had I expanded it nationally, it would probably be one of the most heavily visited restaurant guides on the internet by now. Thirty years later I would be doing precisely the same thing with three hundred thousand products in an internet business I started later. But only in the past few years have I begun to understand the deeper analytics lying underneath all of it.
2001
In 2001, I started the business I still run today. It was a few months before 9/11. There was a credit card as capital, little plan and no runway. I started to help pay the rent. It was before Mark Zuckerberg started at Harvard and created Facebook. Before LinkedIn. Before people even cared about Internet marketing, let alone marketing analytics.
It worked out, faster than I expected. Sales came on the very first day, in July of 2001, on eBay, then fast and furious through the first months. Five figures in the first month. Six figures in the first year. For the first two years I worked seven days a week, ten to twelve hours a day, printing and packing and shipping out of my living room. I have never taken that for granted, because I know exactly what the alternative looked like.
In 2004 I moved to Boston. From 2006 I sold through the large marketplaces, Amazon in particular, as well as business to business directly to retailers.
By 2016 I had earned 7 figures in cumulative revenue on Amazon, without any advertising, based on technical and metadata preparation alone. However, competition arose and the business was closed so I could focus on analyzing what I had done and finding a path to scale beyond Amazon.
I spent the years afterward pulling together fifteen years of metrics from it, which is a strange thing to do with a business you have shut, and which turned out to be the most valuable work I have ever done. Daily sales had kept me so preoccupied for ten years that I never had the chance to analyze things. The tools to do so were not well defined yet either. Doing this is why I can now say precisely what happened rather than approximately.
That gap is worth naming, because it is the most common failure I see in small businesses now. No one has the time to do their own analysis. It is also getting too complex to figure out how to do. Fifteen years of operating produced fifteen years of data, and I looked at almost none of it. I was too busy shipping to pull it all together.
The pandemic stopped almost everything. In 2022 I left Boston for rural Maine. In 2023 I restarted the Amazon business, and I started the graduate work in a digital marketing analytics program that gave me the method to check what all of it had actually taught me.
The first vantage point: who actually bought
I ran a niche business. I sold reproductions of old maps, photographs, prints and artwork that are in the public domain. The images come from the Library of Congress, which has been digitizing millions of images from its shelves going back to the 1800s. I have been cataloging these images since 2001 and there are now more than three hundred thousand of them in my archive. That business has sold to tens of thousands of customers in more than fifty countries.
The business is Snapshots of the Past, and there is a fuller history of the journey on the website at snapshotsofthepast.com.
I was one of the first to take historic prints and reproduce them as a way to satisfy an individual's nostalgia, or longing for the past. A scholarly article has been written about what I do, called “On Nostalgia”.
Who bought
What it taught
The White House
I was selected as a vendor for art print evaluation on the 2008 White House redecoration project. Getting through an institutional procurement screen is its own achievement, and it is not the same as a sale — the evaluation runs a year and almost all of it is invisible to you.
Harvard, the New York Public Library, the Metropolitan Museum of Art, the National Park Service
Institutional buying runs on a calendar and a reference check. It takes a year, and it is worth it, and almost nobody has the patience for it. I sold to the National Park Service alone for over ten years.
HBO, NBC and FOX
Production buyers need certainty about rights more than they need a good picture. Answer that first and you are already ahead.
Cracker Barrel and hundreds of other retailers
Wholesale is a different business from retail wearing the same clothes. Different terms, different volumes, different reasons for saying no.
The president of Panama
An important person, one order, from a country I had never shipped to, or been to. A catalog that is findable is findable from everywhere.
The mayor of Miami Beach
Public figures buy things for their offices like anyone else. The order looked exactly like any other order until I read the name.
A customer in Greenland
Greenland is in the news these days, though not for retail marketing. Fifty-six thousand people live there. One of them found a historical image from a small operation in Maine and bought it. I also learned that mail arrives there on a once-a-week cargo flight from Denmark.
Here is the part that matters. I did not sell to any of them because of a campaign. There was no outbound effort aimed at the president of Panama. What there was instead was carefully structured metadata, a catalog of three hundred thousand items described carefully enough that people looking for something specific could find it. That is it. The long tail.
I was written up early on in the Pittsburgh Post Gazette and a trade publication, Décor Magazine for my efforts. But otherwise, I did very little advertising or PR. And yet I still pulled in 7 figures overall before I closed. That says something. A business was based around the long tail.
And the long tail is where the analytics get interesting, because it is the part most reporting hides. Aggregate numbers make a catalog look like its top sellers. Break the same data out by item and you find that a large share of revenue comes from things that sell once or twice a year — and that those are the orders most likely to come from somewhere remarkable. The Greenland order is not a charming outlier. It is what the distribution actually looks like once you stop averaging it.
What a global customer list teaches that a campaign cannot
Findability beats persuasion when the customer already knows what they want. Most of my best orders came from people I never spoke to. That is a strategic claim, and it decides where a small business should spend.
Description is the product. In a catalog business, how a thing is written about determines whether it exists at all. Metadata quality is a revenue variable, not a housekeeping task.
The institutional buyer and the consumer are not on a spectrum. They are different species with different journeys, different cycle lengths and different decision units. Treating them as one segment loses both.
Reach costs nothing extra once the catalog is right. Fifty countries did not require fifty marketing plans. It required one structure that worked when nobody was watching.
Answering your own customer service mail for twenty-five years is a research method. It is the only channel where people tell you, unprompted and in their own words, exactly where your product confused them.
Ten thousand rides, the people in the back seat, and what you can only see from inside a two-sided marketplace.
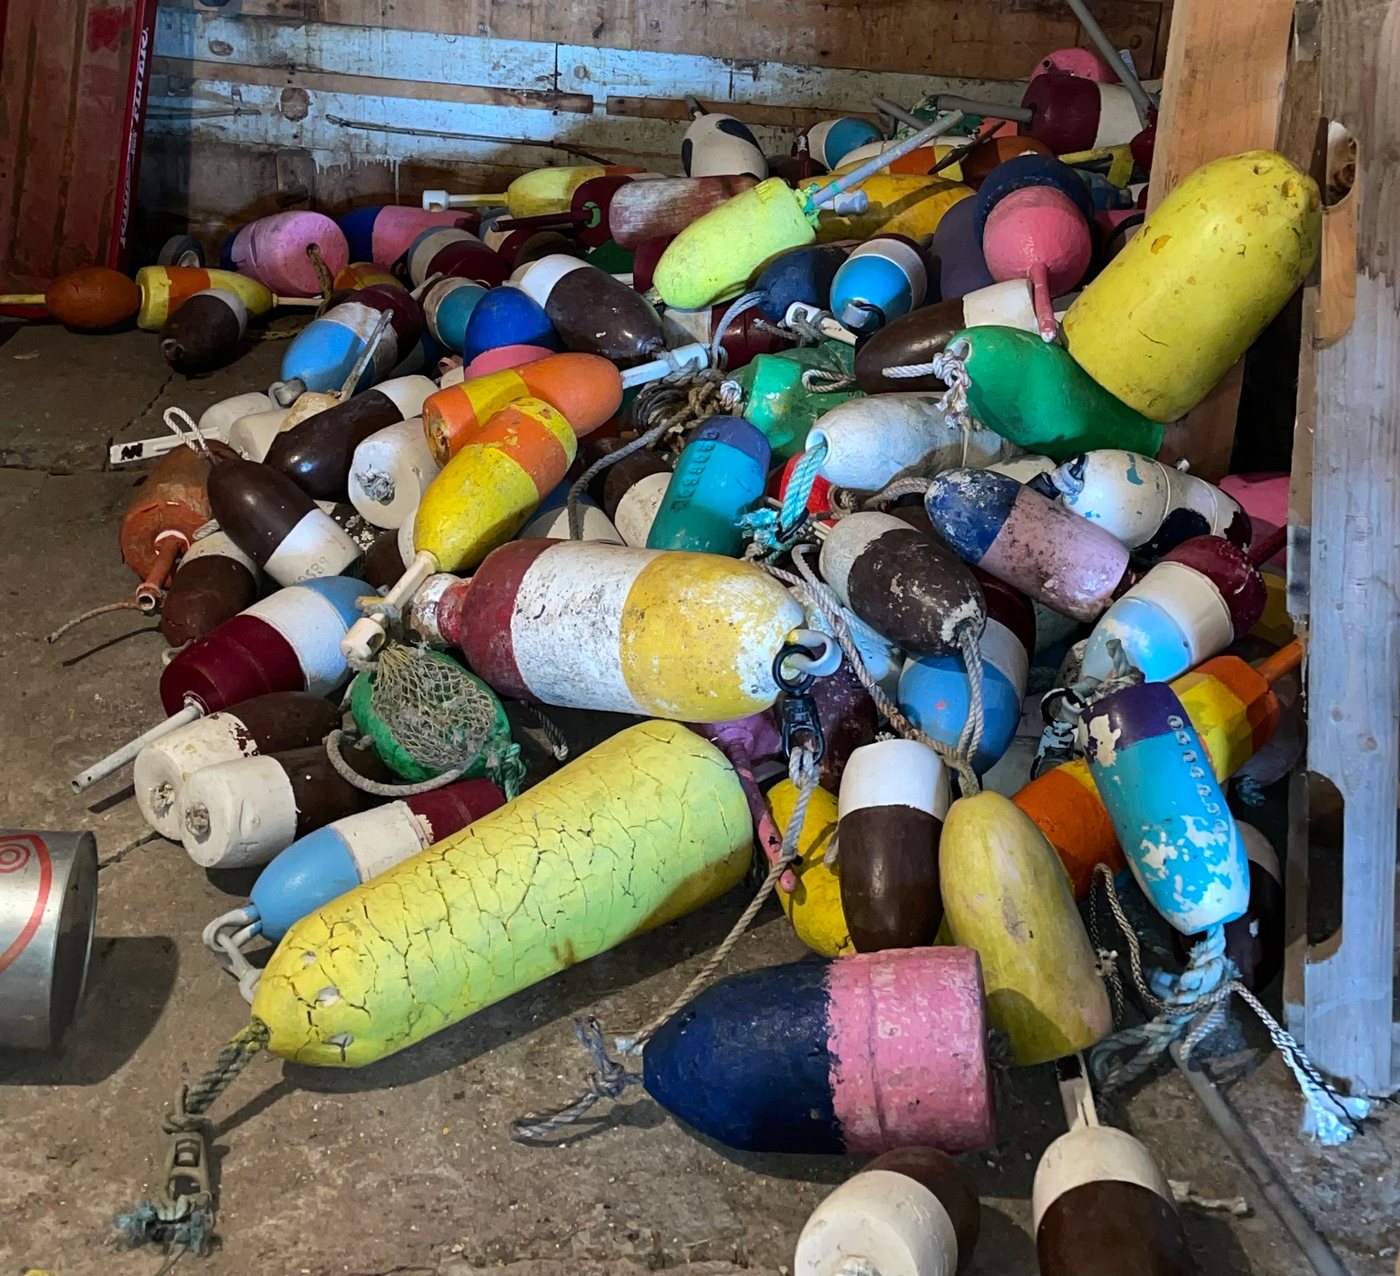
Every buoy is a marker for something on the bottom you cannot see. A fare is the same — the number on the screen is the marker, not the trip.
A second vantage point: twelve years driving for Uber
For 12 of the past 25 years, I also did a side gig. I drove for Uber and Lyft — eight years in Boston and another four in Maine. More than ten thousand rides. Over two hundred thousand miles, through two hundred cities and towns, mostly around Boston and eventually all over New England. Riders from more than fifty countries, by my own count.
I have chatted with thousands of people in those rides, and I have said many times that I do not give rides to A-list Hollywood people. I give rides to people who are A-list in their own world. That is a better sample, because those are the people who actually decide things.
Among the B-listers, as I call them: executives from many Fortune 500 companies, professors, students, business travelers, tourists, locals. Here is a further sampling of these B-list people:
Category
Who
What made it notable
Television, film and music
Ron Hicklin
Lead voice on the Happy Days theme. Also Laverne & Shirley, That Girl, Love American Style, voicings for the Monkees, and the theme to the original M*A*S*H film that became the series theme. His band also sang McDonald's “You Deserve A Break Today.” He said I could name him.
The wife of Mark Wahlberg's hairdresser
He was in town filming a movie.
A rider who partied with Charlie Sheen
In Green Bay, Wisconsin. He texted me the photographs afterwards and said I could use them.
Sports
A driver who lives across from Gronk
He gives rides to Gronk's physical therapist.
Julian Edelman, possibly
Another driver told me he thought he picked him up once.
The mother of a Patriots player
In town to visit her son.
Tom Brady, at three removes
A woman who had been in another car, where that driver had carried a rider who was on the phone with him.
Internet and influence
RiceGum
Ten million subscribers on YouTube. He told me he was a gamer and I had to ask him what a gamer was. It took a dozen teenagers seeing his name in the journal before I understood.
Lilmayo
Two million followers on Instagram. A shirt designer, and the rider who finally explained to me who RiceGum was.
Government
The former Haitian Ambassador to the United Kingdom
The most senior politician I have driven. Haiti and the UK only established relations in 2012.
Intelligence
A British military intelligence officer
Twelve years in Iraq and Syria. He said he spent most of it getting information out of people who did not want to give it to him. I did not ask any more questions. He is now a mild-mannered software man.
History and lineage
An Englishman near Harvard Square
His fourth great-grandfather fought at the Battle of Bunker Hill — for the British. He sent me the whole story.
A descendant of George F. Baker
Founder of Citibank, and the first benefactor of Harvard Business School.
A relative of Neighbor Aber
From Mister Rogers.
Los Angeles, at one remove
A Boston College swimmer
In a single ride: friends with Sylvester Stallone's daughter and with Larry King's son Chance; lived down the street from Kevin Hart, and from Lamar Odom and Khloé Kardashian when they were married; and his mother, a realtor, once showed a house to Serena Williams without knowing who she was.
Academia and technology
Harvard and MIT faculty and students
And people from every other college in the area.
Tech people off every flight
Google, Apple, IBM, Oracle, Red Hat, Microsoft. Boston is second only to San Francisco for technology and startups. I have a two-inch stack of business cards to show for it.
If you want to read more stories, you can visit my Uber blog: bostonautotour.com, and a post I did about more semi-famous people I met. The rider journal itself is collected on the rider references page:
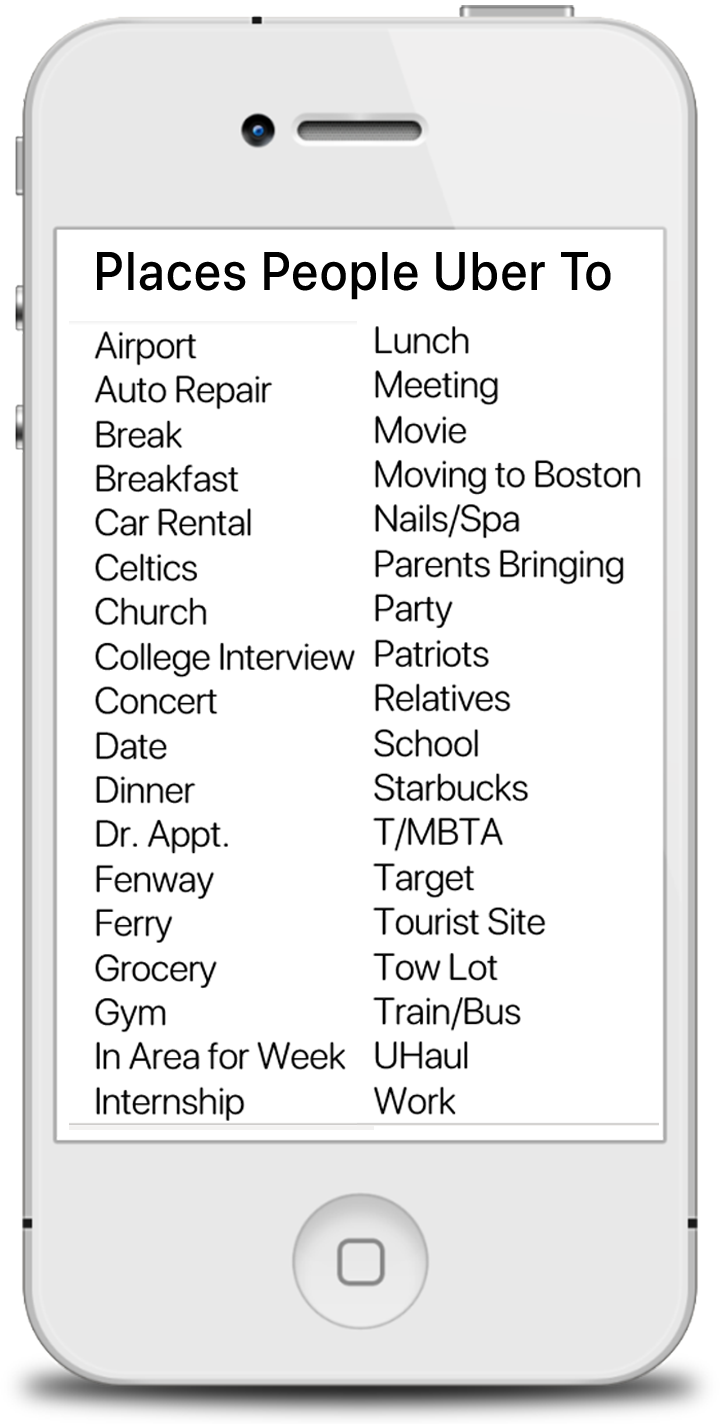
Places people take a car to — kept over twelve years of rides. It is a list of destinations, but read it again and it is really a list of reasons.
At the high end of the list I picked up the director of the US Department of Transportation's official research center, the Volpe Center in Cambridge, Massachusetts, who wanted my view on the region's traffic. A college president who asked me to design a course on driving for Uber - the first college-backed course of its kind in the country. A private equity analyst who worked through potential takeover targets with a client on the way to the airport. The Boston Globe has written about my blog – quoting me as an expert on Uber in the area – and the host of NPR’s All Things Considered in Boston, wanted to interview just before the pandemic broke out. The list goes on and on. The stories are endless. I have been working on a memoir about all of it, but the work of pulling the material into even an outline remains daunting.
How it started, including the part I got wrong
The story of how I got into the Uber thing is itself worth telling. Around Thanksgiving of 2013 I saw a Facebook ad offering twenty-five dollars an hour to drive. There is a curious irony in the fact that thirteen years later it has led to me starting a marketing analytics company. I was forty-seven. I had gone to college. Driving a cab did not strike me as a high-minded pursuit, and I will be honest that some of the hesitation was simple snobbery. I did not want people to know.
It took me three months to submit the paperwork. What finally moved me was not the money. It was that the company started texting me three times a day, every day, until I complied.
This annoyed me enormously. I had not given anyone permission. And then something happened I have thought about ever since: after about a week, I started looking forward to the texts. Somebody was paying attention to me. The irritation flipped into something else, and then I did the thing they wanted.
I have since sat in meetings where people debated whether a follow-up sequence was too aggressive. I have never once heard anyone describe what such a sequence feels like from the other end. I know exactly what it feels like. It worked on me, and I was hostile to it, and I could see it working, and it still worked.
That is worth more than it sounds. Every one of those texts was a data point in somebody's activation funnel, and in their reporting I appear as a conversion after roughly a fortnight of touches. What the report cannot contain is that the early ones made me angry and one somewhere in the middle flipped the whole thing. The shape of that response is invisible in the aggregate, and it is exactly what you would want to know before designing the next sequence.
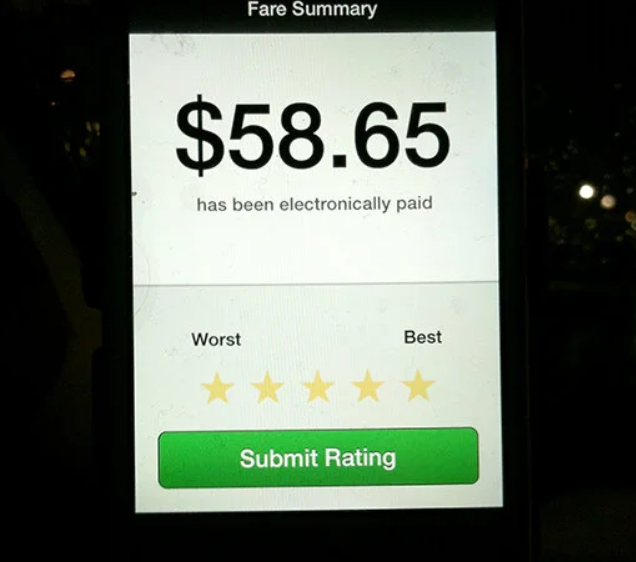
My first ride was on the fifth of February, 2014, at 2:13 in the afternoon, around Harvard Square. It paid six dollars and ninety-one cents, out of which I bought the gas. My first payout, ten days later, was fifty-eight dollars and sixty-five cents. I have never forgotten either number, and together they are the beginning of everything I understand about the difference between revenue and margin.
I’ve read the CEO of Uber has done a few rides as an Uber driver to see what it was like. I’ve done 10,000.
The first payout, ten days in: fifty-eight dollars and sixty-five cents — and underneath it, the five stars that governed the next twelve years.
What the driver's seat shows you
Four things, and they compound.
You are on both sides of the transaction
I was a supplier on a two-sided marketplace and a customer of it at the same time. I was rated. I was priced. I was dispatched by an algorithm that never explained itself. I was given fifteen seconds to accept work, offered bonuses at thresholds designed to keep me driving past the point I wanted to stop, and penalized for cancelling by one company and not the other.
There is a very large literature on platform economics and almost all of it is written from outside. Uber is also not especially forthcoming with data to help researchers study the business. When I read about dynamic pricing I am reading about something that has taken money out of my pocket and put money into it on the same night, for reasons I could watch happening on a map on my dashboard. It is also, not incidentally, the same thing I have lived through as a marketplace seller for thirteen years on the other side of my business.
Being on both sides is what lets you tell a pricing model from a pricing story. Surge is usually explained as a demand response. From inside, it is also a supply-recruitment tool, and those two purposes produce different behavior at the edges. You cannot see that from the passenger seat and you will not find it in a public dataset.
Nobody knew they were being observed
Riders were not recruited. They were not paid. They did not know that when they got out I would sometimes dictate a note about what they had said. They did know I intended to publish something built on their journal entries — I told everyone who wrote in it that I was doing so, and nobody objected. Hundreds of them told me plainly that it was a project worth doing, and that they would pay money for what I was going to produce.
Whatever a paid focus group participant does to be helpful to the moderator, they did not do. There was no moderator — just a stranger driving, no eye contact, a fixed end time, and no consequences at all for saying what you actually thought. Those turn out to be close to ideal conditions for candor.
This matters because it addresses the largest known weakness in the data marketers usually rely on. Stated preference and revealed preference come apart, and every survey-based segmentation carries that gap inside it. What I have instead is a very large set of unprompted statements from people with no incentive to manage my impression of them. That does not make it representative. It makes it honest, which is a different and rarer property.
The range is impossible to buy
In one week I might drive the head of a federal research center, a cook working a summer visa with no other way to reach his job, a lobsterman, a teacher who used to own five Otto's pizza stores and took an enormous pay cut to walk away from them (and called himself the happiest he had ever been), and three actors traveling from New York to a physical theater school in a Maine town of a few thousand people. The stories never end.
A commercial panel would price that range out of reach, and a screener would exclude half of them for not fitting a category.
It ran for twelve years
I watched an entire industry mature one release at a time. First the custom iPhone Uber mailed me when I started and took a deposit on, then the first appearance of surge zones, then the arrival of food delivery, then the slow tightening of everything — all while our pay fell by half from what it was when we started. Uber used to hand every driver a huge stack of roses just before Valentine's Day, to give to riders. No more. Twelve years of anything is a longitudinal study. I did not know to call it that at the time.
Longitudinal is the word that matters. Most marketing measurement is one snapshot compared against another snapshot. Very little of it can tell you what a change felt like to the people it happened to, in order, over a decade.
Two instruments measured the same rides. Then the dead ends, and what I do with all of it.
A dozen of the same thing, no two alike. That is the back seat, and it is why the notebook caught what a survey panel would have screened out.
The drivers notes and the in-car journal
At some point I began taking notes. To date I have a hundred pages of them — single-spaced bullet points of things I saw and things people told me.
Later I put a blank journal in the back seat with an arrow and two words: WRITE HERE. That is the entire mechanism. No app, no incentive, no follow-up email, no request. Hundreds of people filled it in over the following years. They wrote about where they were going and why. They left recipes — a startling number of recipes. They left restaurant recommendations in nineteen states and four countries. They drew pictures. They wrote to whoever would read the page next, which is not something I asked for and not something I expected.
One rider called it a mobile recipe wagon. Another took a second ride with me weeks later and said the best part was reading what had been added since.
Why the journal is the most useful thing in this essay
Two instruments measured the same rides. A five-star tap at the end, and a blank page in the back seat.
The star rating is a well-designed metric by every conventional standard. It is universal, cheap, comparable, near-total in coverage — I have thousands of them — and it fed an algorithm that determined whether I kept working. It also told me almost nothing. It recorded whether anything had gone wrong. It could not record what had happened.
The journal has none of those virtues. Coverage is partial. The sample is self-selected toward people who felt like writing. Nothing in it is comparable to anything else. You could not build a dashboard from it.
And it produced hundreds of pages of what people were actually carrying around.
It is worth being precise about why, because the reasons transfer to any feedback mechanism you own.
It asked for nothing specific, so it did not constrain the answer to a scale somebody else designed.
It was anonymous, and anonymity raised the quality of what people wrote rather than lowering it.
It was physical, and it sat in a shared space where a bored person would pick it up. Friction near zero, at the exact moment of idleness.
Crucially, the audience was not me. People were writing to each other. That one design choice changed what got written more than anything else did.
I have spent a lot of professional time on feedback mechanisms — surveys, review prompts, post-purchase emails, star ratings. The ten-dollar journal outperformed all of them. Not because it was more rigorous, but because the instrument was designed for the answer rather than for the report.
That is the lesson I would hand to anyone running a business. Before you ask what your numbers say, ask what your instrument is capable of recording. Most of the time the honest answer is: less than you have been assuming.
The parts that did not work
I would rather put these near the front than bury them.
I once had an excellent conversation on the way to the airport with a vice president of data science at a large job-search company — Monster.com, to be exact. This was at a point when the company that old-timers remember as the leading job search site of the early internet had been failing and was being rebooted. We talked the whole ride about why her company was losing ground to two competitors, LinkedIn and Indeed.
As I had just studied machine learning in a graduate program, I told her I could put together a study on how it could benefit Monster. She was excited to receive it. So I built her a deck laying out what I thought the answer was. She was complimentary. Then nothing. No rejection, no follow-up, no explanation. That is the single most common outcome of a great meeting and almost nobody writes about it.
And yet there I was, the Uber driver, probably the first person to advise Monster.com on how machine learning could help their business. This was around 2017, which I have since learned is the year Google created the Transformer ML architecture that became the backbone of the AI systems everybody uses today.
On the business side there are equivalents. Proposals that went unanswered. Institutional relationships that took three years and produced one order. A catalog of three hundred thousand items where a meaningful share has never sold at all. And fifteen years of data I did not analyze until after I had closed the business.
I am telling you this because I am about to publish a lot of material drawn from these twenty-five years, and its value depends entirely on whether you believe I am reporting straight. A version containing only the good parts would not be worth reading.
What I actually do with it
None of the above is evidence on its own, and I want to be exact about that.
The driving is a convenience sample of people who happened to hail a car in one part of the country. It skews toward travelers, toward people heading to an airport, and toward people willing to talk to a stranger. It has no control group. The customer record is one business in one niche. Neither generalizes by itself.
What they produce is hypotheses — and hypotheses that almost nobody else has access to, which is the point. A hypothesis you can get from an industry report is one your competitor already has. The work is then to take it somewhere it can be checked. Against server logs. Against public archives of how websites are actually built. Against a structured assessment run the same way across a hundred and eighty-seven organizations. Against numbers that do generalize.
That is the method, and it is the same one I use on client work. Notice something in the field. Form a specific claim. Go and see whether the data supports it. Report what you find, including when it does not.
It is also why the storytelling and the analytics are not two separate things here. The story is where the hypothesis comes from. The analysis is what decides whether it survives. A story without the check is an anecdote. A number without the story behind it is a chart nobody knows what to do with.
What this blog is going to be
A series.
Some of it will be about pricing, because I have watched thousands of people decide what something was worth to them at the moment they decided it — and set prices myself, early on without proper research, and later with the benefit of full data analysis. Some of it will be about reputation systems, because I lived under one for twelve years and sold under another for thirteen. Some of it will be about catalogs, description and findability, which is the least fashionable subject in marketing and the one that built my business.
Some of it will be about how holiday demand actually behaves, because I have run through over two dozen Christmas seasons online and the pattern held every time. Some of it will be about the segments nobody serves, because I drove them. Some of it will be about what people believe is happening to their data, which is wildly different from what is actually happening and matters more to your marketing than the truth does.
Every one of them will follow the same shape. Here is what I saw. Here is what I think it means. Here is what would have to be true for me to be right. Where I have checked it, I will show you the check. Where I have not, I will say so.
And some of it will just be a story about a person in a car, or an order that arrived from Greenland on an ordinary Tuesday, because that is where all of it came from.
One rule before I start. Most of the people in these stories will not be named. Organizations that bought from me are a matter of business record and appear as themselves. People who told me about their own business, named it, and left me their details extended an invitation, and I will treat it as one. Everyone else appears as a role — a banker, a teacher, an engineer. The personal things people wrote in that notebook because it felt like a safe place to put them stay exactly where they are.